


 6 / 56

2016 HIGHLIGHTS
DISTRIBUTION PER UNIT
16.79
CENTS
TOTAL INCOME
$150.2
M
NET TANGIBLE ASSETS PER UNIT
$2.56
>> 3.7 per cent increase in income to $150.2 million for the year
>> Final distribution of 8.50 cents, bringing the full year distribution
to 16.79 cents, up 6.0 per cent on the previous year
>> Finalised the upgrade of the Lismore and Rockingham Bunnings
Warehouse stores
>> Completed the divestment of the Blacktown industrial property
>> 14 market rent reviews were finalised during the year –
weighted average 5.8 per cent increase in annual rent; including
10 Bunnings Warehouses – weighted average 5.8 per cent
increase in annual rent
>> Like-for-like rental growth of 2.3 per cent for the 12 months to
30 June 2016
>> Weighted average cost of debt of 5.0 per cent for the year,
4.9 per cent at year end
>> Weighted average lease expiry of 5.9 years at 30 June 2016,
portfolio 99.7 per cent leased
>> Net revaluation gain on the property investment portfolio of
$202.6 million for the year
>> Net tangible assets of $2.56 per unit at 30 June 2016 (2015:
$2.24 per unit), up 14.3 per cent on the previous year
>> Gearing (debt/total assets) 21.5 per cent at 30 June 2016
0%
5%
10%
15%
20%
25%
30%
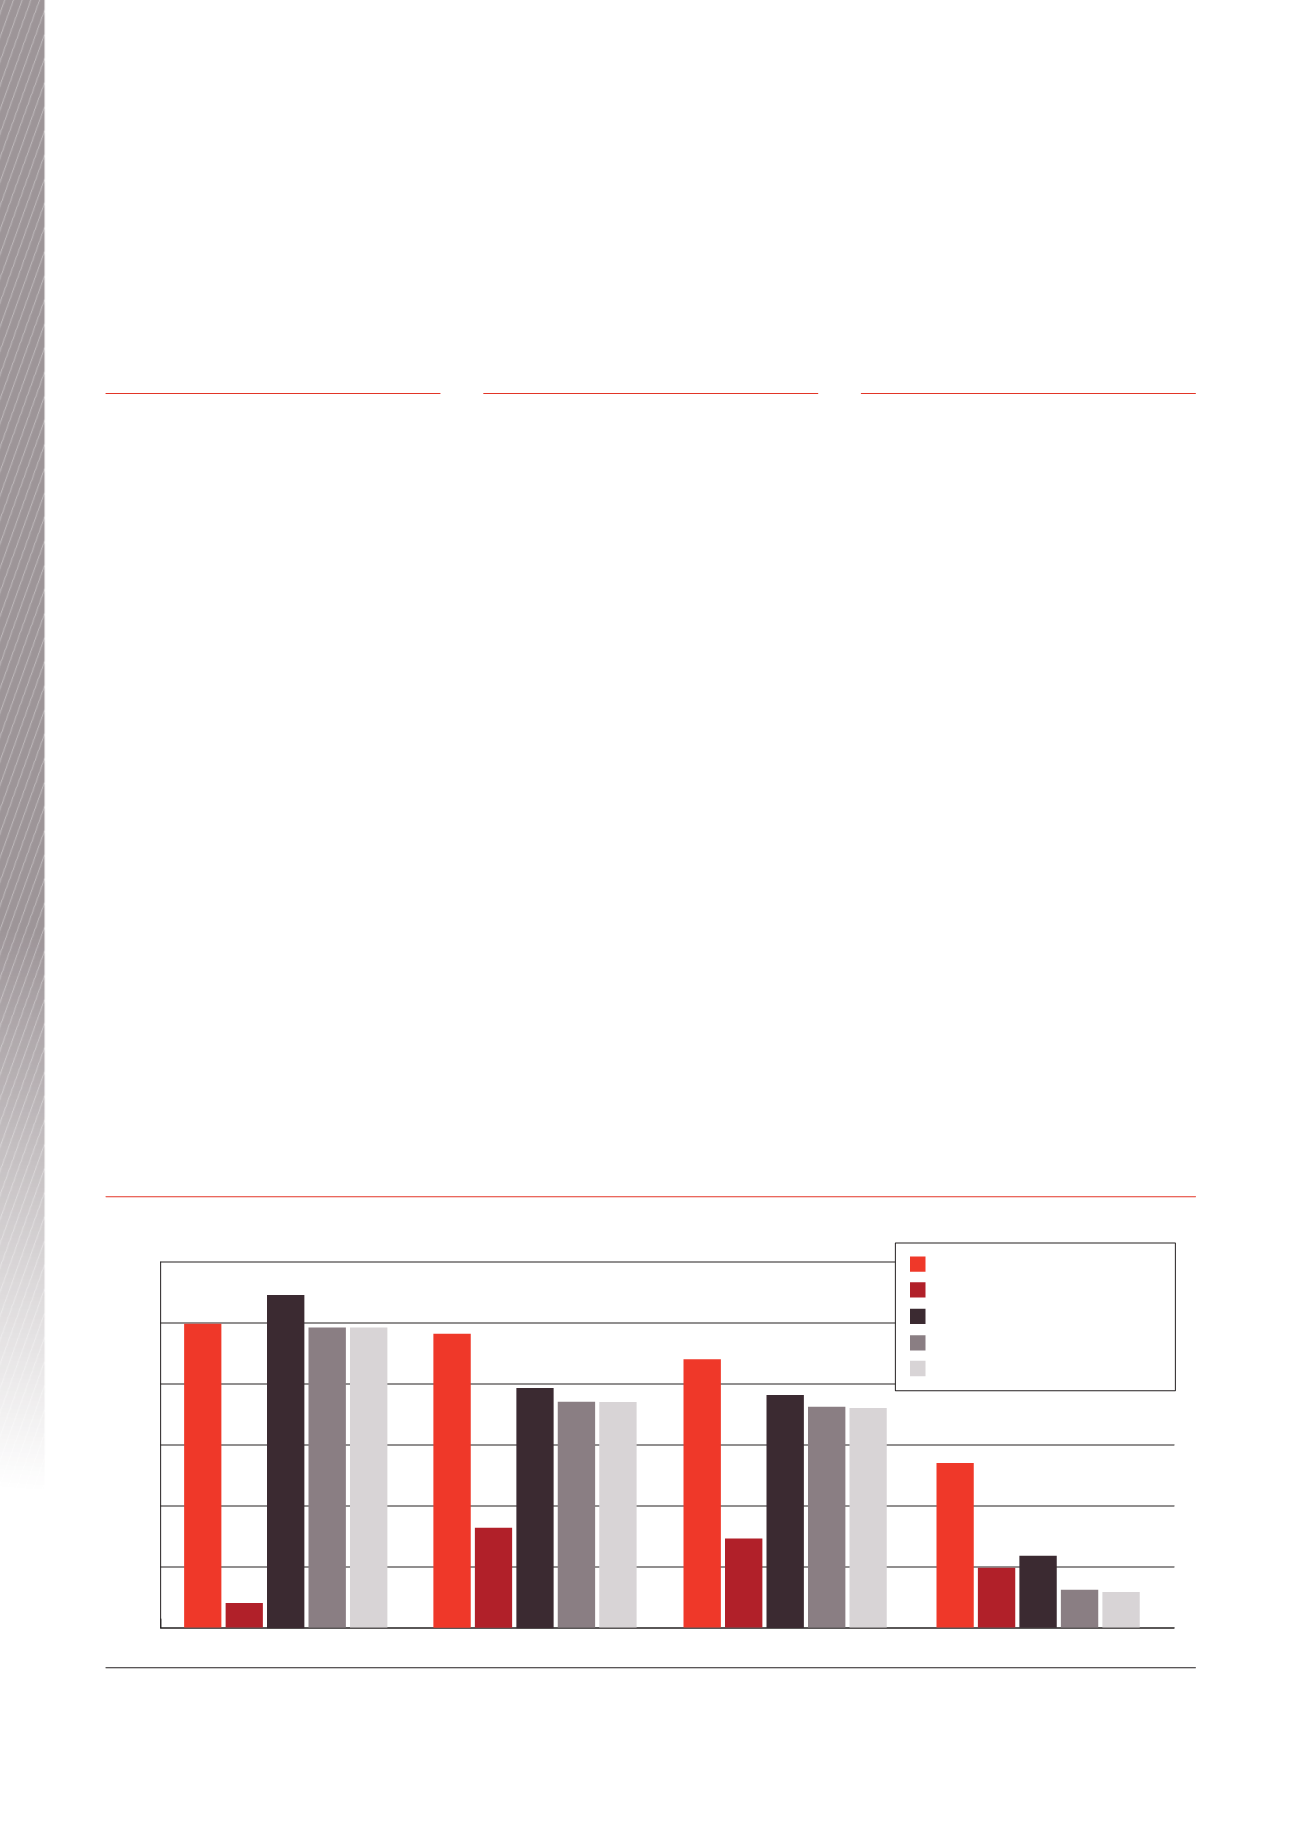
One year
Three years
2
Five years
2
Ten years
2
BWP Trust (BWP)
ASX All Ordinaries Accumulation Index
UBS Retail 200
S&P/ASX 200 Property Accumulation Index
S&P/ASX 300 Property Accumulation Index
24.9
24.1
8.2
19.7 18.5 18.5
22.0
7.3
19.1
18.1 18.0
13.5
4.9 5.9
3.1 2.9
2.0
27.3
24.6 24.6
BWP total returns compared to market indices for periods ended 30 June 2016 (%)
1
1
Total returns include distributions and movement in price (assumed distributions are reinvested). Source: UBS Australia
2
Annual compound returns
BWP Trust Annual Report 2016
4
Overview