


 12 / 56

average price of the Trust’s units for the 20 trading days from and
including 6 July 2016 to 2 August 2016, with no discount applied.
Units to be allocated under the DRPwere acquired on market during
the time and will be transferred to participants on 25 August 2016.
Capital management
The Trust is committed to maintaining a strong investment
grade rating (currently A-/Stable by Standard & Poor’s) through
appropriate capital and balance sheet management.
DEBT FUNDING
The Trust’s debt facilities as at 30 June 2016 are summarised below.
Limit
$m
Amount
drawn
$m
Expiry
date
Bank debt facilities
Australia and New Zealand
Banking Group Limited
110.0
81.4 1 July 2018
Commonwealth Bank of
Australia
110.0
85.2 31 July 2020
Westpac Banking
Corporation
135.0
105.7 30 April 2020
Corporate bonds
Fixed term five-year
corporate bond
200.0
200.0 27 May 2019
Total
555.0
472.3
As at 30 June 2016, the weighted average duration of the Trust’s
debt facilities was 3.2 years to expiry (2015: 4.2 years) and
average utilisation of debt facilities (average borrowings/average
facility limits) for the year was 87.1 per cent (2015: 80.4 per cent).
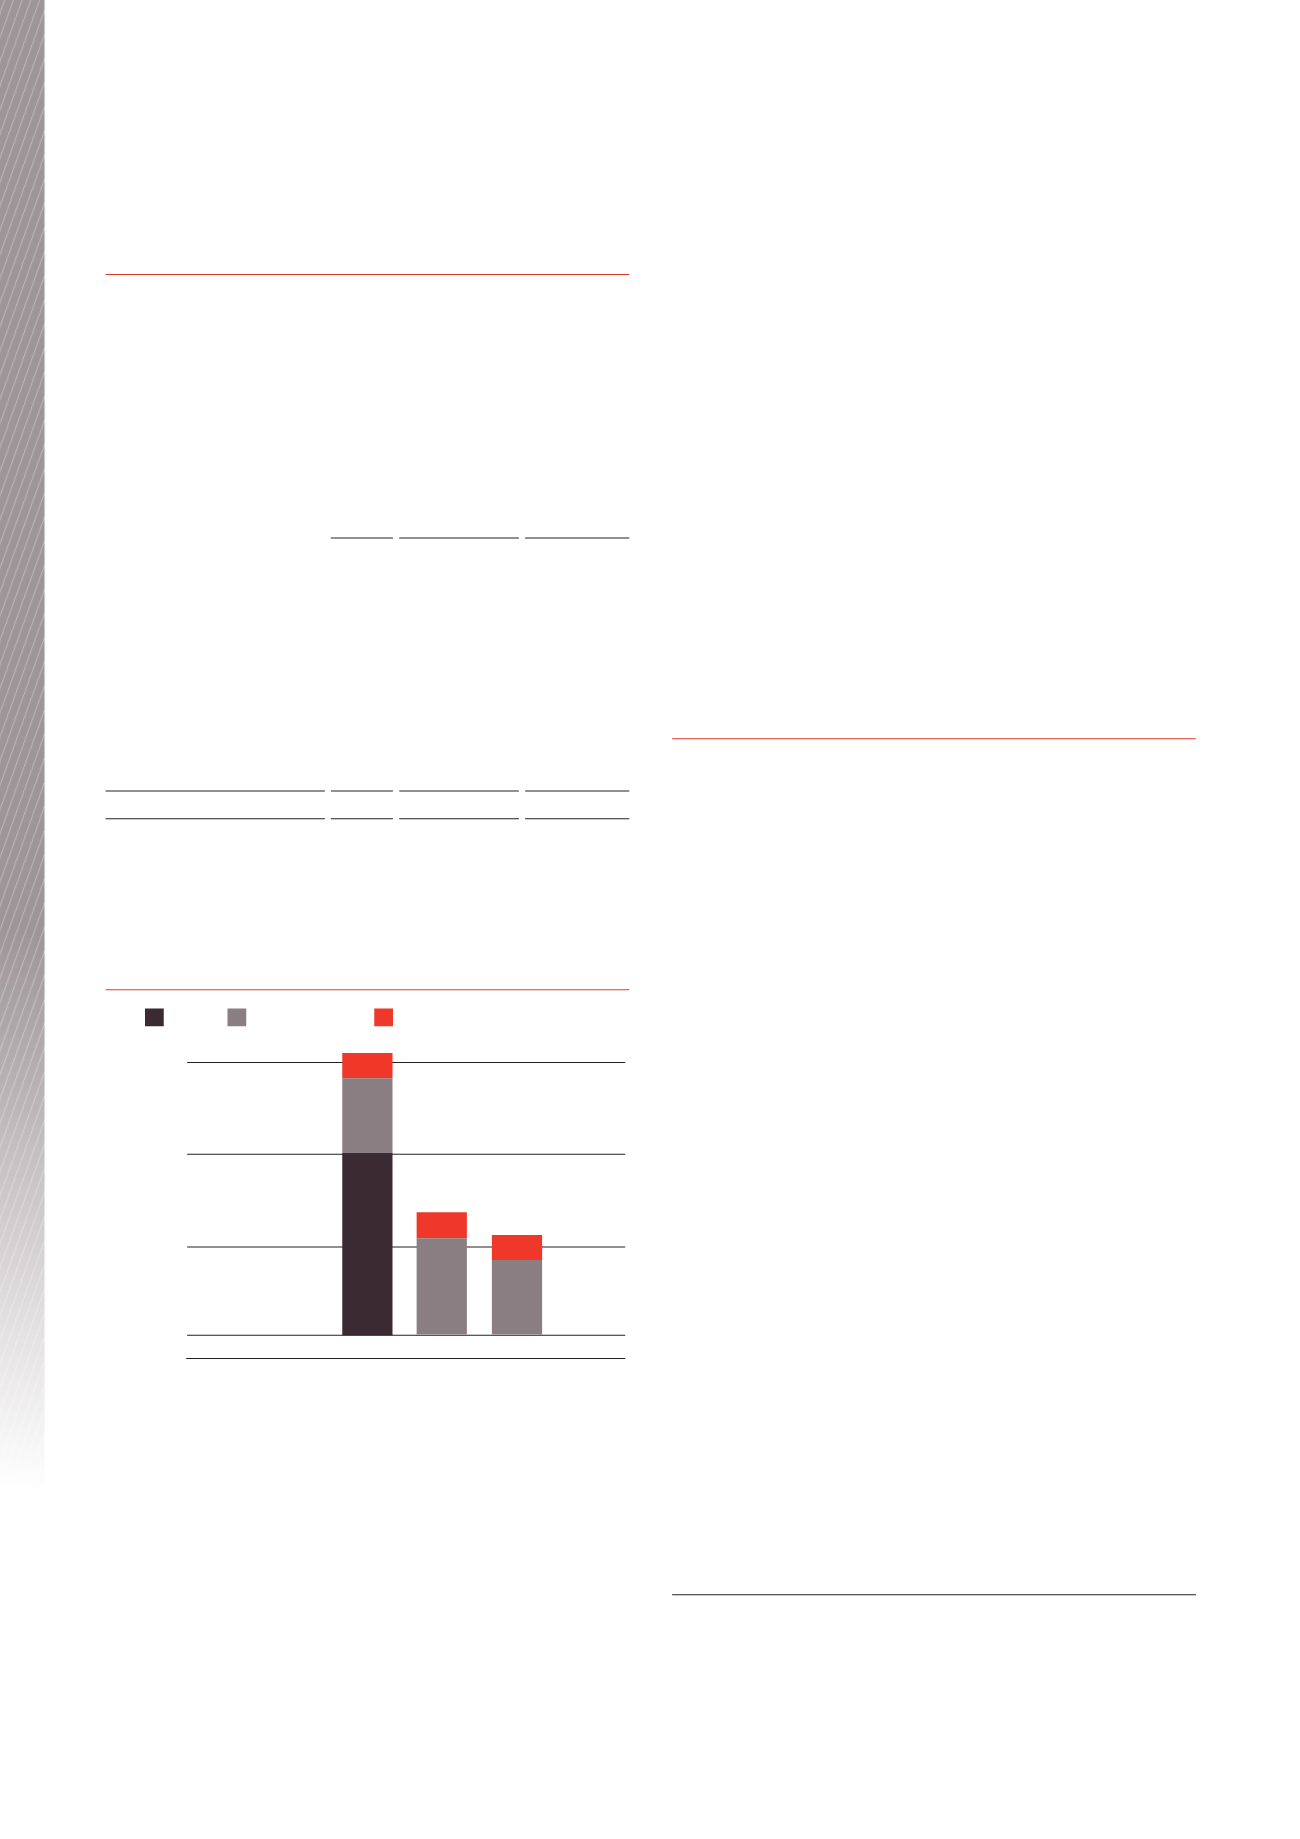
Debt maturity profile
Bonds
Drawn bank facilities
Undrawn bank facilities
FY17
0
100
200
Volume (A$M)
300
FY18 FY19 FY20 FY21
FY22
28.6
81.4
200 29.3
105.7
24.8
85.2
INTEREST RATE RISK MANAGEMENT
The Trust takes out interest rate swaps and fixed rate corporate
bonds (hedging) to create certainty of the interest costs of the
majority of borrowings over the medium to long term. As at 30
June 2016, the Trust’s interest rate hedging cover was 79.4 per cent
of borrowings, with $175.0 million of interest rate swaps and the
$200.0 million fixed rate corporate bond, against interest bearing
debt of $472.3 million. The weighted average term to maturity of
hedging was 2.63 years, including delayed start swaps.
Due to the accounting requirement to mark the value of interest
rate swap hedges to market, the Trust’s hedging liabilities
decreased to approximately $10.0 million as at 30 June 2016
(2015: $10.9 million). The decrease in hedging liability during the
year was due to the reduction in the average term of maturity of the
interest rate swap profile. The hedging liability assesses the potential
liability if all hedges were to be terminated at 30 June 2016.
GEARING
The Trust’s gearing ratio (debt to total assets) at 30 June 2016 was
21.5 per cent (2015: 24.1 per cent), which is at the lower end of the
Board’s preferred range of 20 to 30 per cent. This should allow the
Trust to take advantage of opportunities to create long term value
when they arise. The interest cover ratio (earnings before interest
and tax/interest expense) was 5.6 times (2015: 5.1 times).
DISTRIBUTION REINVESTMENT PLAN
The DRPwas in place for both the interim distribution and final
distribution for the year ended 30 June 2016. The Trust has
continued to maintain an active DRP as a component of longer-term
capital management and to allow unitholders flexibility in receiving
their distribution entitlements. The DRP provides a measured and
efficient means of accessing additional equity capital from existing
eligible unitholders when required.
Operating environment
BUNNINGS – THE TRUST’S KEY CUSTOMER CONTRIBUTING
93 PER CENT OF RENTAL INCOME
Bunnings is the leading retailer of home improvement and outdoor
living products in Australia and New Zealand and a major supplier to
project builders, commercial tradespeople and the housing industry.
As at June 2016, Bunnings had a network of 240 Bunnings
Warehouse stores across Australia and New Zealand, around 70
smaller format stores and 33 trade centres
1
.
As at 30 June, 2016, approximately 93 per cent of the Trust’s
annual rental income is from Bunnings and therefore the Trust’s
earnings are linked to the ongoing success of the Bunnings business
and the strength and direction of the underlying home improvement
and outdoor living markets.
For the financial year ended 30 June 2015, Bunnings reported
revenue of $9.534 billion and EBIT of $1.088 billion
2
. In the period
from 30 June 1995 to 30 June 2015, Bunnings grew sales and
earnings before interest and tax (“EBIT”) at a compound annual
growth rate of 16.1 per cent per annum and 20.3 per cent per
annum, respectively
3
.
For the nine month period ended 31 March 2016, Bunnings
reported sales of $8.09 billion, up 10.9 per cent on the previous
corresponding period
4
.
At the recent Wesfarmers Strategy Briefing Day, Bunnings
re-confirmed its strong focus on long termvalue creation through
a winning offer to customers, an engaged, focused and committed
team, business behaviour that builds trust, and sustainable returns
5
.
Bunnings presented its 2016/17 strategic agenda with a focus on
creating better customer experiences, strengthening the core of
1
Source: Wesfarmers Strategy Briefing Day, 22 June 2016, page 59
2
Source: Wesfarmers 2015 full-year results announcement, 20 August 2015,
page 9
3
Source: Wesfarmers Strategy Briefing Day, 22 June 2016, page 37
4
Source: Wesfarmers third quarter results announcement, 21 April 2016, page 1
5
Source: Wesfarmers Strategy Briefing Day, 22 June 2016, page 36
BWP Trust Annual Report 2016
10
Business Review